Calculation of resistances in ventilation systems. Calculator for calculating and selecting components of the ventilation system Pressure loss of the supply and exhaust system
Anyone's heart ventilation system with mechanical induction of air flow is a fan, which creates this flow in the air ducts. The power of the fan directly depends on the pressure that must be created at the outlet from it, and in order to determine the magnitude of this pressure, it is required to calculate the resistance of the entire system of channels.
To calculate the pressure loss, you need the layout and dimensions of the duct and additional equipment.
Initial data for calculations
When the diagram of the ventilation system is known, the dimensions of all air ducts are selected and additional equipment is determined, the diagram is depicted in a frontal isometric projection, that is, a perspective view. If it is carried out in accordance with the current standards, then all the information necessary for the calculation will be visible on the drawings (or sketches).

- Floor plans can be used to define lengths horizontal sections air ducts. If, on the axonometric diagram, the elevation marks are put on which the channels pass, then the length of the horizontal sections will also become known. IN otherwise sections of the building with laid routes of air ducts will be required. And as a last resort, when there is not enough information, these lengths will have to be determined using measurements at the installation site.
- The diagram should be depicted using legend all additional equipment installed in the channels. These can be diaphragms, motorized dampers, fire dampers, as well as devices for distributing or exhausting air (grilles, panels, umbrellas, diffusers). Each piece of this equipment creates resistance in the air flow path, which must be taken into account when calculating.
- In accordance with the regulations on the diagram near conditional images air ducts must be marked with air flow rates and channel sizes. These are the defining parameters for calculations.
- All shaped and branching elements should also be reflected in the diagram.
If such a scheme is on paper or in in electronic format does not exist, then you will have to draw it at least in a rough version, you cannot do without it when calculating.
Back to the table of contents
Where to start?

Diagram of head loss per meter of duct.
Very often you have to deal with enough simple schemes ventilation, in which there is an air duct of the same diameter and there is no additional equipment. Such circuits are calculated quite simply, but what if the circuit is complex with many branches? According to the method for calculating pressure losses in air ducts, which is described in many reference publications, it is necessary to determine the longest branch of the system or the branch with the greatest resistance. It is rarely possible to find out the resistance by eye, therefore it is customary to calculate along the longest branch. After that, using the air flow rates indicated on the diagram, the entire branch is divided into sections according to this feature. As a rule, the costs change after branching (tees) and when dividing it is best to focus on them. There are other options, for example, supply or exhaust grilles built directly into the main duct. If this is not shown on the diagram, but there is such a lattice, it will be necessary to calculate the flow rate after it. Sections are numbered starting from the farthest from the fan.
Back to the table of contents
Calculation order

The general formula for calculating the pressure loss in the ducts for the entire ventilation system is as follows:
H B = ∑ (Rl + Z), where:
- H B - pressure loss in the entire duct system, kgf / m²;
- R - friction resistance of 1 m of an air duct of equivalent cross-section, kgf / m²;
- l is the length of the section, m;
- Z is the amount of pressure lost by the air flow in local resistance(shaped elements and additional equipment).
Note: the value of the cross-sectional area of the duct involved in the calculation is taken initially as for the circular shape of the duct. Friction resistance for channels rectangular determined by the cross-sectional area equivalent to a round one.
The calculation starts from the most distant site number 1, then go to the second site and so on. The results of calculations for each section are added, which is indicated by the mathematical sign of the summation in the calculation formula. The parameter R depends on the diameter of the channel (d) and the dynamic pressure in it (P d), and the latter, in turn, depends on the speed of the air flow. The coefficient of absolute wall roughness (λ) is traditionally taken as for an air duct made of galvanized steel and is 0.1 mm:
R = (λ / d) P d.

It makes no sense to use this formula in the process of calculating pressure losses, since the values of R for different speeds air and diameters have already been calculated and are reference values (RV Shchekin, IG Staroverov - reference books). Therefore, it is simply necessary to find these values in accordance with the specific conditions of movement of air masses and substitute them in the formula. Another indicator, the dynamic pressure P d, which is associated with the parameter R and is involved in the further calculation of local resistances, is also a reference value. Given this relationship between the two parameters, they are listed together in the reference tables.
The value Z of pressure losses in local resistances is calculated by the formula:
Z = ∑ξ P d.
The summation sign means that you need to add the calculation results for each of the local resistances in a given section. In addition to the already known parameters, the formula contains the coefficient ξ. Its value is dimensionless and depends on the type of local resistance. The parameter values for many elements of ventilation systems are calculated or determined empirically, therefore, they are in reference literature... The local resistance coefficients of ventilation equipment are often indicated by the manufacturers themselves, having determined their values experimentally in production or in a laboratory.

Having calculated the length of section No. 1, the number and type of local resistances, all parameters should be correctly determined and substituted into the calculation formulas. Having received the result, go to the second section and further, to the fan itself. In this case, one should not forget about that section of the air duct, which is located already behind ventilation unit, because the fan pressure should be enough to overcome its resistance.
Having finished the calculations along the longest branch, they make the same ones along the neighboring branch, then along the next one, and so on until the very end. Usually, these branches all have many common areas, so the calculations will go faster. The purpose of determining the pressure losses on all branches is their common coordination, because the fan must distribute its flow evenly throughout the system. That is, ideally, the pressure loss in one branch should differ from the other by no more than 10%. In simple words This means that the branch closest to the fan should have the highest resistance, and the farthest branch should have the lowest. If this is not the case, it is recommended to return to the recalculation of the diameters of the air ducts and the air velocities in them.
|
Appointment |
Basic requirement | ||||
| Noiselessness | Min. head loss | ||||
| Trunk channels | Main channels | Branches | |||
| Inflow | Hood | Inflow | Hood | ||
| Living spaces | 3 | 5 | 4 | 3 | 3 |
| Hotels | 5 | 7.5 | 6.5 | 6 | 5 |
| Institutions | 6 | 8 | 6.5 | 6 | 5 |
| Restaurants | 7 | 9 | 7 | 7 | 6 |
| The shops | 8 | 9 | 7 | 7 | 6 |
Based on these values, you should calculate linear parameters air ducts.
Algorithm for calculating the loss of air pressure
The calculation must begin with drawing up a diagram of the ventilation system with the obligatory indication of the spatial arrangement of air ducts, the length of each section, ventilation grilles, additional equipment for air purification, technical fittings and fans. Losses are determined first for each separate line, and then they are summed up. For a separate technological section, the losses are determined using the formula P = L × R + Z, where P is the losses air pressure in the calculated area, R - losses on running meter section, L - total length of air ducts in the section, Z - losses in additional fittings of the ventilation system.
To calculate the pressure loss in a circular duct, the formula Ptr is used. = (L / d × X) × (Y × V) / 2g. X is the tabular coefficient of air friction, depends on the material of the air duct, L is the length of the calculated section, d is the diameter of the air duct, V is the required air flow rate, Y is the air density taking into account the temperature, g is the acceleration of falling (free). If the ventilation system has square ducts, then table No. 2 should be used to convert round values to square ones.
Tab. No. 2. Equivalent diameters of round ducts for square
| 150 | 200 | 250 | 300 | 350 | 400 | 450 | 500 | |
| 250 | 210 | 245 | 275 | |||||
| 300 | 230 | 265 | 300 | 330 | ||||
| 350 | 245 | 285 | 325 | 355 | 380 | |||
| 400 | 260 | 305 | 345 | 370 | 410 | 440 | ||
| 450 | 275 | 320 | 365 | 400 | 435 | 465 | 490 | |
| 500 | 290 | 340 | 380 | 425 | 455 | 490 | 520 | 545 |
| 550 | 300 | 350 | 400 | 440 | 475 | 515 | 545 | 575 |
| 600 | 310 | 365 | 415 | 460 | 495 | 535 | 565 | 600 |
| 650 | 320 | 380 | 430 | 475 | 515 | 555 | 590 | 625 |
| 700 | 390 | 445 | 490 | 535 | 575 | 610 | 645 | |
| 750 | 400 | 455 | 505 | 550 | 590 | 630 | 665 | |
| 800 | 415 | 470 | 520 | 565 | 610 | 650 | 685 | |
| 850 | 480 | 535 | 580 | 625 | 670 | 710 | ||
| 900 | 495 | 550 | 600 | 645 | 685 | 725 | ||
| 950 | 505 | 560 | 615 | 660 | 705 | 745 | ||
| 1000 | 520 | 575 | 625 | 675 | 720 | 760 | ||
| 1200 | 620 | 680 | 730 | 780 | 830 | |||
| 1400 | 725 | 780 | 835 | 880 | ||||
| 1600 | 830 | 885 | 940 | |||||
| 1800 | 870 | 935 | 990 |
The horizontal is the height of the square duct, and the vertical is the width. The equivalent value of the circular section is at the intersection of the lines.
The air pressure losses in the bends are taken from table no. 3.
Tab. No. 3. Pressure loss at bends
To determine the pressure loss in the diffusers, the data from Table 4 are used.
Tab. No. 4. Pressure loss in diffusers

Table 5 gives a general diagram of losses in a straight section.
Tab. No. 5. Diagram of air pressure losses in straight air ducts

All individual losses in this section of the duct are summed up and corrected with table No. 6. Tab. No. 6. Calculation of the decrease in flow pressure in ventilation systems

During design and calculations, existing regulations it is recommended that the difference in the magnitude of pressure losses between individual sections does not exceed 10%. The fan should be installed in the section of the ventilation system with the highest resistance, the farthest air ducts should have the lowest resistance. If these conditions are not met, then it is necessary to change the layout of air ducts and additional equipment, taking into account the requirements of the provisions.
In order for the air exchange in the house to be "correct", even at the stage of drawing up the ventilation project, an aerodynamic calculation of the air ducts is needed.
Air masses moving through the channels of the ventilation system are taken as an incompressible liquid during calculations. And this is completely allowed, for too great pressure is not formed in the air ducts. In fact, pressure is formed as a result of air friction against the walls of the channels, and even when resistances of a local nature appear (these include pressure - surges at places where direction changes, when connecting / disconnecting air flows, in areas where regulating devices or where the diameter of the ventilation duct changes).
Note! The concept of aerodynamic calculation includes determining the cross section of each of the sections of the ventilation network that ensure the movement of air flows. Moreover, the pumping resulting from these movements is also determined.

In accordance with many years of experience we can safely say that sometimes some of these indicators are already known during the calculation. Below are the situations that are often encountered in this kind of cases.
- The cross-sectional index of the cross-sectional channels in the ventilation system is already known, it is required to determine the pressure that may be required in order to the right amount gas moved. This often happens in those air conditioning lines where the cross-sectional dimensions were based on technical or architectural characteristics.
- We already know the pressure, but we need to determine the cross-section of the network to provide the ventilated room with the required volume of oxygen. This situation inherent in networks natural ventilation, in which the already existing head cannot be changed.
- None of the indicators is known, therefore, we need to determine both the head in the line and the cross section. This situation is found in most cases in the construction of houses.

Features of aerodynamic calculations
Let's get acquainted with the general method for carrying out this kind of calculations, provided that both the cross section and the pressure are unknown to us. Let's make a reservation right away that the aerodynamic calculation should be carried out only after the required volumes of air masses have been determined (they will pass through the air conditioning system) and the approximate location of each of the air ducts in the network has been designed.

And in order to carry out the calculation, it is necessary to draw an axonometric diagram, in which there will be a list of all the elements of the network, as well as their exact dimensions. In accordance with the plan of the ventilation system, the total length of the air ducts is calculated. After that, the entire system should be divided into segments with homogeneous characteristics, according to which (only individually!) The air consumption will be determined. Typically, for each of the homogeneous sections of the system, a separate aerodynamic calculation of the air ducts should be carried out, because each of them has its own speed of movement of air flows, as well as a permanent flow rate. All the indicators obtained must be entered into the axonometric diagram already mentioned above, and then, as you probably already guessed, you must select the main highway.
How to determine the speed in ventilation ducts?
As can be judged from all that has been said above, it is necessary to choose the longest chain of consecutive network segments as the main highway; in this case, numbering should begin exclusively from the most remote area. As for the parameters of each of the sections (and these include the air flow rate, section length, its serial number, etc.), they should also be entered in the calculation table. Then, when the introduction is finished, the shape of the cross-section is selected and its - sections - dimensions are determined.

LP / VT = FP.
What do these abbreviations stand for? Let's try to figure it out. So in our formula:
- LP is the specific air flow rate in the selected area;
- VT is the speed at which air masses move along this section (measured in meters per second);
- FP is the channel cross-sectional area we need.
What is characteristic, when determining the speed of movement, it is necessary to be guided, first of all, by considerations of economy and noise of the entire ventilation network.
Note! According to the indicator obtained in this way (we are talking about a cross-section), it is necessary to select an air duct with standard values, and its actual cross-section (denoted by the abbreviation FФ) should be as close as possible to the previously calculated.
LP / FФ = VФ.
Having received an indicator of the required speed, it is necessary to calculate how much the pressure in the system will decrease due to friction against the walls of the channels (for this, a special table must be used). As for the local resistance for each of the sections, they should be calculated separately, and then summed up in the overall indicator. Then, by summing the local resistance and frictional losses, the total air conditioning system loss can be obtained. In the future, this value will be used to calculate the required amount of gas masses in the ventilation ducts.

Air heating unit
Earlier we talked about what an air heating unit is, talked about its advantages and areas of application, in addition to this article, we advise you to read this information
How to calculate the pressure in the ventilation network
In order to determine the estimated pressure for each individual area, you must use the formula below:
H x g (PH - PB) = DPE.
Now let's try to figure out what each of these abbreviations stands for. So:
- H in this case denotes the difference in the marks of the mine mouth and the intake grate;
- РВ and РН is an indicator of gas density, both outside and inside the ventilation network, respectively (measured in kilograms per cubic meter);
- Finally, DPE is a measure of what the natural disposable pressure should be.
We continue to analyze the aerodynamic calculation of air ducts. To determine the internal and external density, you must use a look-up table, and the temperature indicator inside / outside must also be taken into account. As a rule, the standard outside temperature is taken as plus 5 degrees, and regardless of which specific region of the country is planned construction works... And if the outside temperature is lower, then as a result, the discharge into the ventilation system will increase, due to which, in turn, the volumes of the incoming air masses will be exceeded. And if the temperature outside, on the contrary, is higher, then the pressure in the line will decrease because of this, although this nuisance, by the way, can be quite compensated for by opening the vents / windows.

As for the main task of any described calculation, it consists in choosing such ducts where the losses in the sections (we are talking about the value? (R * l *? + Z)) will be lower than the current DPE indicator, or, as an option, at least equal his. For greater clarity, we present the moment described above in the form of a small formula:
DPE? ? (R * l *? + Z).
Now let's take a closer look at what the abbreviations used in this formula mean. Let's start at the end:
- Z in this case is an indicator indicating a decrease in the speed of air movement due to local resistance;
- ? - this is the value, more precisely, the coefficient of what is the roughness of the walls in the line;
- l is another simple value that indicates the length of the selected section (measured in meters);
- finally, R is a measure of friction loss (measured in pascals per meter).


Well, we figured it out, now let's find out a little about the roughness indicator (that is?). This indicator depends only on what materials were used in the manufacture of channels. It is worth noting that the speed of air movement can also be different, so this indicator should also be taken into account.
Speed - 0.4 meters per second
In this case, the roughness indicator will be as follows:
- for plaster with reinforcing mesh - 1.48;
- for slag gypsum - about 1.08;
- for ordinary bricks - 1.25;
- and for cinder concrete, respectively, 1.11.
Speed - 0.8 meters per second
The metrics described here will look like this:
- for plaster with reinforcing mesh - 1.69;
- for slag gypsum - 1.13;
- for ordinary brick - 1.40;
- finally, for cinder concrete - 1.19.
Let's increase the speed of the air masses a little.
Speed - 1.20 meters per second
For this value, the roughness indicators will be as follows:
- for plaster with reinforcing mesh - 1.84;
- for slag gypsum - 1.18;
- for ordinary bricks - 1.50;
- and, therefore, cinder concrete - somewhere around 1.31.
And the last indicator of speed.
Speed - 1.60 meters per second
Here the situation will look like this:
- for plaster with reinforcing mesh, the roughness will be 1.95;
- for slag gypsum - 1.22;
- for ordinary brick - 1.58;
- and, finally, for cinder concrete - 1.31.
Note! We figured out the roughness, but it is worth noting one more important point: in this case, it is advisable to take into account a small margin, fluctuating within ten to fifteen percent.
We deal with the general ventilation calculation
When making an aerodynamic calculation of air ducts, you must take into account all the characteristics of the ventilation shaft (these characteristics are given below in the form of a list).
- Dynamic pressure (to determine it, the formula is used - DPE? / 2 = P).
- Air mass consumption (it is denoted by the letter L and is measured in cubic meters per hour).
- Pressure loss due to air friction against the inner walls (denoted by the letter R, measured in pascals per meter).
- Duct diameter (for calculation this indicator the following formula is used: 2 * a * b / (a + b); in this formula, the values a, b are the dimensions of the channel cross-section and are measured in millimeters).
- Finally, speed is V, measured in meters per second, as we mentioned earlier.
 >
>
As for the direct sequence of actions in the calculation, it should look something like the following.
Step one. First, determine the required channel area, for which the following formula is used:
I / (3600xVpek) = F.
Let's deal with the values:
- F in this case is, of course, the area, which is measured in square meters;
- Vpek is the desired speed of air movement, which is measured in meters per second (for canals, a speed of 0.5-1.0 meters per second is taken, for mines - about 1.5 meters).
Step three. The next step is to determine the appropriate duct diameter (denoted by the letter d).
Step four. Then the remaining indicators are determined: pressure (denoted as P), speed of movement (abbreviated V) and, therefore, decrease (abbreviated R). For this, it is necessary to use the nomograms according to d and L, as well as the corresponding coefficient tables.
Step five... Using already other tables of coefficients (we are talking about indicators of local resistance), it is required to determine how much the effect of air will decrease due to local resistance Z.
Step six. On the the last stage calculations, it is necessary to determine the total losses on each separate section of the ventilation line.
Pay attention to one important point! So, if the total losses are lower than the already existing pressure, then such a ventilation system can be considered effective. But if the losses exceed the pressure indicator, then it may be necessary to install a special throttle diaphragm in the ventilation system. Thanks to this diaphragm, the excess head will be extinguished.
We also note that if the ventilation system is designed to serve several rooms at once, for which the air pressure must be different, then during calculations it is necessary to take into account the vacuum or back pressure indicator, which must be added to the total loss indicator.
Video - How to make calculations using the "VIX-STUDIO" program
The aerodynamic calculation of air ducts is considered mandatory procedure, an important component of planning ventilation systems. Thanks to this calculation you can find out how effectively the premises are ventilated with a particular section of the channels. And the efficient functioning of ventilation, in turn, ensures the maximum comfort of your stay in the house.
An example of calculations. The conditions in this case are as follows: an administrative building has three floors.
The basis for the design of any engineering networks is the calculation. In order to correctly design a network of supply or exhaust air ducts, it is necessary to know the parameters of the air flow. In particular, it is required to calculate the flow rate and pressure loss in the channel for correct selection fan power.
In this calculation, an important role is played by such a parameter as dynamic pressure on the walls of the duct.
Behavior of the medium inside the duct
A fan that creates an air flow in the supply or extract air duct imparts potential energy to this flow. In the process of moving in limited space pipes, the potential energy of the air is partially converted into kinetic energy. This process occurs as a result of the impact of flow on the channel walls and is called dynamic pressure.

In addition to it, there is static pressure, this is the effect of air molecules on each other in a stream, it reflects its potential energy. The kinetic energy of the flow reflects the indicator of the dynamic impact, which is why this parameter is involved in the calculations.
When constant flow air, the sum of these two parameters is constant and is called total pressure. It can be expressed in absolute and relative units. The reference point for absolute pressure is the total vacuum, while the relative is considered starting from atmospheric, that is, the difference between them is 1 atm. As a rule, when calculating all pipelines, the value of the relative (excess) impact is used.
Back to the table of contents
The physical meaning of the parameter

If we consider straight sections of air ducts, the cross-sections of which decrease at a constant air flow rate, then an increase in the flow rate will be observed. In this case, the dynamic pressure in the air ducts will increase, and the static pressure will decrease, the magnitude of the total impact will remain unchanged. Accordingly, for the flow to pass through such a constriction (confuser), it should initially be informed required amount energy, otherwise consumption may decrease, which is unacceptable. Having calculated the magnitude of the dynamic effect, it is possible to find out the amount of losses in this confuser and to select the correct power of the ventilation unit.
The opposite process will occur in the case of an increase in the channel section at a constant flow rate (diffuser) The speed and dynamic impact will begin to decrease, the kinetic energy of the flow will turn into potential. If the head developed by the fan is too high, the flow rate in the area and in the entire system can increase.
Depending on the complexity of the circuit, ventilation systems have many turns, tees, constrictions, valves and other elements called local resistances. The dynamic impact in these elements increases depending on the angle of attack of the flow on the inner wall of the pipe. Some parts of the systems cause a significant increase in this parameter, for example, fire dampers in which one or more dampers are installed in the flow path. This creates an increased flow resistance in the section, which must be taken into account in the calculation. Therefore, in all of the above cases, you need to know the value of the dynamic pressure in the channel.
Back to the table of contents
Parameter calculations by formulas
In the straight section, the air velocity in the duct is unchanged, and the magnitude of the dynamic effect remains constant. The latter is calculated by the formula:
Рд = v2γ / 2g
In this formula:

- Рд - dynamic pressure in kgf / m2;
- V is the speed of air movement in m / s;
- γ — specific gravity air in this area, kg / m3;
- g - acceleration of gravity, equal to 9.81 m / s2.
You can get the value of the dynamic pressure in other units, in Pascals. For this, there is another variation of this formula:
Рд = ρ (v2 / 2)
Here ρ is the air density, kg / m3. Since in ventilation systems there are no conditions for compressing the air medium to such an extent that its density changes, it is assumed constant - 1.2 kg / m3.
Next, you should consider how the value of the dynamic impact is involved in the calculation of the channels. The meaning of this calculation is to determine the losses in the entire supply system or exhaust ventilation for the selection of the fan head, its design and engine power. Calculation of losses occurs in two stages: first, friction losses against the channel walls are determined, then the drop in the air flow power in local resistances is calculated. The dynamic pressure parameter is involved in the calculation at both stages.
Friction resistance per 1 m of a round duct is calculated by the formula:
R = (λ / d) Рд, where:
- Рд - dynamic pressure in kgf / m2 or Pa;
- λ is the coefficient of friction resistance;
- d is the diameter of the duct in meters.

Friction losses are determined separately for each section with different diameters and flow rates. The resulting R value is multiplied by the total length of the channels of the calculated diameter, the losses on local resistances are added, and total value for the whole system:
HB = ∑ (Rl + Z)
Here's the options:
- HB (kgf / m2) - total losses in the ventilation system.
- R - friction loss per 1 m of a circular channel.
- l (m) - section length.
- Z (kgf / m2) - losses in local resistances (branches, crosses, valves, and so on).
Back to the table of contents
Determination of parameters of local resistances of the ventilation system
The value of the dynamic impact also takes part in determining the parameter Z. The difference with a straight section is that in different elements of the system the flow changes its direction, forks, converges. In this case, the medium interacts with the inner walls of the channel not tangentially, but under different angles... To take this into account, you can enter a trigonometric function into the calculation formula, but there are a lot of difficulties. For example, when passing through a simple 90⁰ bend, the air turns and presses against the inner wall at at least three different angles (depending on the design of the bend). There are a lot of more complex elements in the duct system, how to calculate the losses in them? There is a formula for this:
- Z = ∑ξ Рд.
In order to simplify the calculation process, a dimensionless coefficient of local resistance is introduced into the formula. For each element of the ventilation system, it is different and is a reference value. The values of the coefficients were obtained by calculations or experimentally. Many manufacturing plants that produce ventilation equipment carry out their own aerodynamic research and product calculations. Their results, including the coefficient of local resistance of the element (for example, fire damper), entered into the product passport or placed in technical documentation on their website.
To simplify the calculation of ventilation duct losses, all dynamic action values for different speeds also calculated and tabulated, from which they can be simply selected and inserted into formulas. Table 1 shows some values for the most commonly used air velocities in air ducts.
The distribution of pressures in the ventilation system must be known when setting up and regulating the system, when determining costs in individual sections of the system and when solving many other ventilation problems.
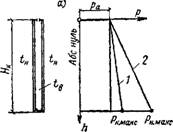
Distribution of pressures in ventilation systems with mechanical induction of air movement. Consider an air duct with a fan (Fig. XI.3). In section 1- /, the static pressure is zero (that is, it is equal to the air pressure at the level of the air duct). The total pressure in this section is equal to the dynamic pressure рді determined by the formula (XI.1). In section II-II, the static pressure pstіі> 0 (numerically equal to the pressure loss due to friction between sections II-II and I- /). With a constant duct cross-section, the static pressure line is straight. The total pressure line is also straight,
Parallel to the pst line. The vertical distance between these lines determines the dynamic pressure pDi.
In the diffuser located between sections II-II and III-III, the flow rate changes. The dynamic pressure decreases along the air path. In this regard, the static pressure changes and may even increase, as shown in the figure (pstіі> pstііі).
The total pressure in section III-III, created by the fan, is lost in friction Drtr and in local resistances (diffuser Lrdif, at the Arnykh outlet). The total pressure loss on the discharge side is:
The static pressure outside the duct on the suction side is zero. In the immediate vicinity of the opening within the suction flare, the air stream already has kinetic energy. The vacuum within the suction flare is negligible.
At the entrance to the duct, the flow rate increases, which means that the kinetic energy of the flow also increases. Consequently, according to the law of conservation of energy, the potential energy of the flow must decrease. Taking into account pressure losses L /? POT in any section from the suction side
Per = 0 - pd - Drpot - (XI. 24)
In the suction duct, as well as on the discharge side, the total pressure is equal to the pressure difference at the beginning of the duct and the pressure loss up to the considered section:
Рп = 0-ДрпОт. (XI.25)
From formulas (XI.24) and (XI.25) it follows that in each section of the air duct from the suction side, the values of p0t and pn are less than zero. In absolute value, the static pressure is greater than the total pressure, however, formula (XI.2) is also valid for this case.
The static pressure line runs below the total pressure line. A sharp drop in the static pressure line after section VI-VI is explained by the narrowing of the flow at the inlet to the duct due to the formation of a vortex zone. Between cross-sections V-V and IV-IV, the diagram shows a confuser with a turn. A decrease in the line of static pressure between these sections is due to an increase in both the flow rate in the confuser and the pressure loss. Static pressure plots in Fig. XI.3 are shaded.
At point B, the lowest total pressure in the duct system is observed. Numerically, it is equal to the pressure loss on the suction side:
|
|

A - full and static in the discharge duct; b - the same, in the suction air duct; in - dynamic in the discharge air duct; g - dynamic in the suction duct
The fan creates a differential pressure equal to the difference between the maximum and minimum value total pressure (ppb - Ppb)> increasing the energy of 1 m3 of air passing through it by an amount
The pressure created by the fan is spent on overcoming the resistance to air movement through the ducts:
Rveitis = DRvs + Drnagn. (XI. 27)
Professor PN Kamenev proposed to plot the pressure diagrams on the suction air duct from the absolute zero pressure (absolute vacuum). In this case, the construction of the pst.abs and p.abs lines fully corresponds to the case of injection.
The pressure in the air ducts is measured with a micromanometer. To measure static pressure, the hose from the micromanometer is connected to a fitting attached to the wall of the air duct, and to measure the total pressure, to a pneumometric Pitot tube, the opening of which is directed towards the flow (Fig. XI.4, a, b).
The difference between the total and static pressures is equal to the value of the dynamic pressure. This difference can be measured directly with a micromanometer, as shown in Fig. XI.4, in, d. The speed is determined by the value of pd, m / s:
V = V2prfp, (XI. 28)
By which the air flow rate in the duct is calculated, m3 / h:
L = ZbOOy /. (XI. 29)
Pressure distribution in ventilation systems with natural induction of air movement. The peculiarities of such systems are the vertical arrangement of their channels in the building, low values of the available pressures and, therefore, low speeds. The operation of systems with natural induction of air movement depends on the design features of the system and the building, the difference in the density of the outside and inside air, the speed and direction of the wind. However, when choosing structural dimensions individual elements ventilation systems (cross-sections of channels and shafts, areas of louvered grilles), it is enough to carry out a calculation for the case when the building does not affect the operation.
|
|
|
|

A - diagrams of absolute aerostatic pressures in the channel closed with plugs 1 - inside the channel; 2 - outside the channel; b - diagram of excess pressures in the same channel; c - diagrams of excess pressures prn air movement along the channel; d - diagrams of excess pressures in the mine and in the "wide channel" attached to it; e-diagrams of excess pressures in the channel and shaft in the presence of a branch; e - diagrams of excess pressures with natural induction of air movement in the ventilation system multi-storey building; g - diagrams of excess pressures with mechanical induction of air movement; (pst> Pn ~ lines, respectively, of the static n total pressure inside the channel and the shaft; Pn is the line of static pressure outside the channel n of the shaft)
Consider simplest case when the vertical channel is Yak high, filled warm air with temperature tB, closed at the top and bottom with plugs. The duct is surrounded by outside air with a temperature ta.
Suppose that the pressure inside and outside the channel at the level of its top is equal to pa (to ensure this condition, it is sufficient to leave small hole). Then, in accordance with Pascal's law, the absolute pressure at any level (at a distance h from the top of the channel) is equal to: outside pst n = pa4 - ^ phn £, and inside pstk = pa4 - --hpBg. The distribution of absolute pressures inside the channel (line 1) and outside it (line 2) is shown in Fig. XI.5, a.
In the “channel - ambient air” system, one can use conditional values of excess pressures, ie conditionally take the aerostatic pressure inside the channel at any level as zero. The diagram of these pressures outside the channel has the shape of a triangle (Fig. XI.5,6J. The base of the triangle
Drk = Nk Drg
The available pressure, Pa, determines the movement of air through the channel.
When air moves through the channel (Fig. XI.5, c), the pressure losses are the sum of the inlet, friction and outlet losses. In fig. XI.5, c shows the distribution of total and static pressures (in excess pressures relative to the conditional zero). Dynamic pressure рд is equal to the difference between рп and рст. The static pressure (its diagram is shaded in the figure) along the entire length of the channel is less than the excess aerostatic pressure outside the channel, ph. In some cases, ZONES WITH Pst> pH can be observed in the channel. For example, in the channel before the constriction (Fig. XI.5, d), under certain conditions, the static pressure may exceed the pressure pH. Contaminated air will leak through the leaks in this zone of the channel.
If vertical ventilation duct combines two (Fig. XI, 5, (3) or more (Fig. XI.5, e) branches, it is recommended to connect them not at the level of the air inlet into the branch, but slightly higher (one, two floors or more). This recommendation is given taking into account the accumulated operating experience.When connecting a branch at the level of point A instead of the level of point B, the available pressure of Drotv increases (see Fig. XI.5, e); therefore, the channel resistance and the stability of the system also increase.
In fig. XI.5, e, f, the static pressure plots are shaded. The total pressure decreases along the height to the value of the outlet losses, and the dynamic pressure at a constant channel cross-section increases along the height, since after connecting the branch, the flow rate in the channel increases.
Recently, ventilation systems with vertical ducts and mechanical induction of air movement have been introduced. In these systems, air is moved by a fan and gravitational forces. The construction of the pressure distribution in such systems is similar to that considered above. The peculiarity is that the static pressure in front of the fan is determined by the vacuum generated by the fan (see the diagram in Fig. XI.5, g). In this case, the available pressure for air movement in the system